ALIGNMENT | INTERNSHIP
Visualizing team alignment through an interactive dashboard

MY ROLE
Product Design Intern
TEAMMATE
Jim Benton (CEO)
TOOLS
Figma, Webflow
TIMELINE
Jun - Sep 2024
DESCRIPTION
A concept (later iterated & shipped!) of a quarterly team performance dashboard to improve customer leadership understand
CONTEXT
During summer 2024, I had the pleasure of working at Alignment as a Product Design Intern.
Alignment is a strategic collaboration platform that helps stay aligned by streamlining goal-setting, performance tracking, and decision-making, I worked on enhancing the usability and functionality of key enterprise tools.
After being onboarded, one of my first tasks was to conduct a UX audit of the platform. A primary issue that I found was within the connection within the 5-step Alignment Playbook
FINAL DESIGN PREVIEW
A single-page, all-inclusive dashboard
Jump to Final Designs
PROBLEM
The Alignment Playbook wasn’t reaching it’s full potential
The 5-step Alignment Playbook was the core quarterly system that Alignment uses to help teams set goals, track progress, and reflect on their performance.
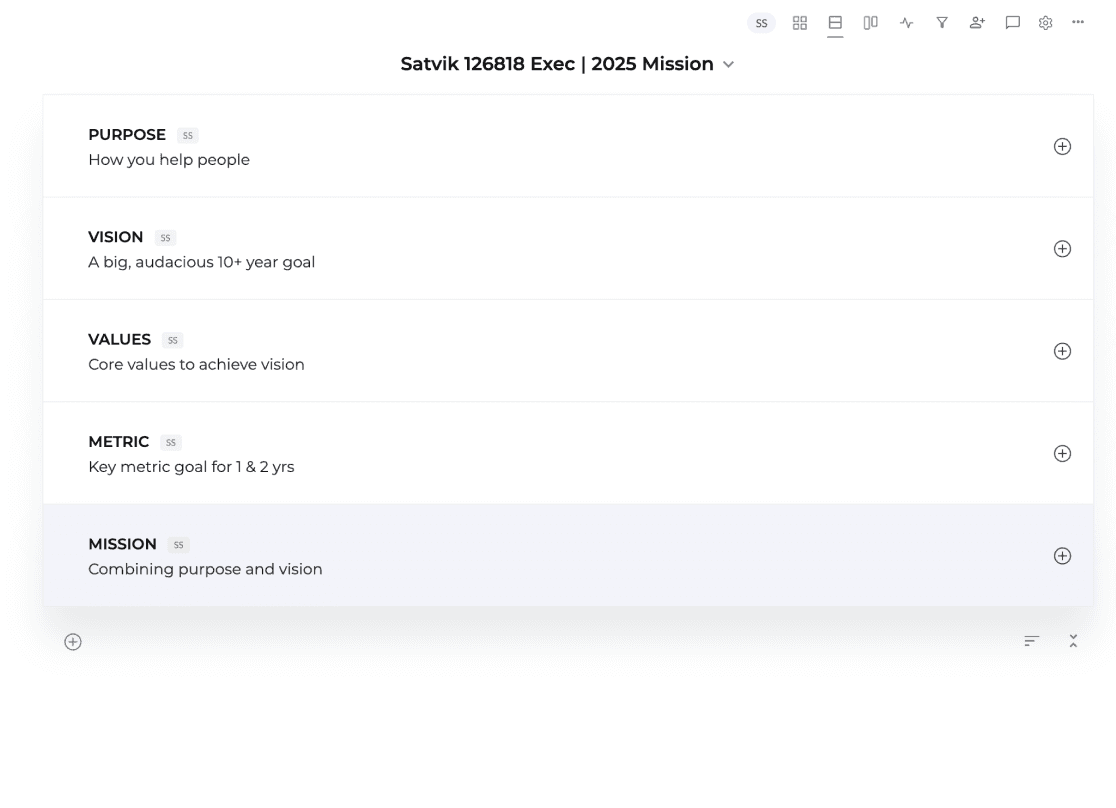
1
Mission
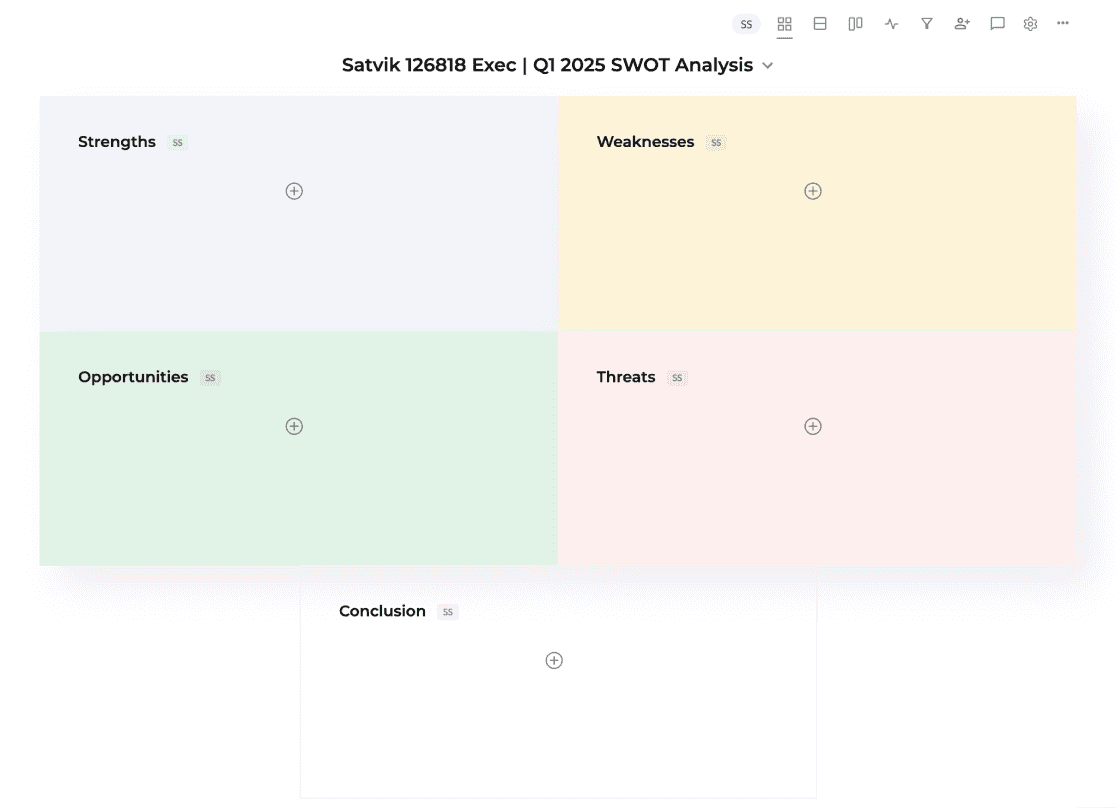
2
SWOT
3
OKR
4
Mission
5
SWOT
Which each step was valuable on its own, I discovered that the steps operated more like individual frameworks rather than a cohesive, easy-to-follow flow that teams can utilize successfully to make the most out of their quarter.
1
2
5
4
3
The Alignment Playbook had an unorganized flow.
After conducting my UX audit, I presented my key findings to the team, emphasizing that the lack of cohesion between the steps in the Alignment Playbook was a major usability challenge. This disconnect seemed to make it difficult for teams to seamlessly transition between steps, potentially reducing engagement and limiting the system’s full potential.
FLUSHING OUT THE PROBLEM
Expanding the problem scope via meeting with 2 close customers
To validate my claim, we set up calls with two close customers, aiming to understand how they navigated the Alignment Playbook throughout their quarter and held their teams accountable. During these interviews, they described struggling with fragmented workflows, making it difficult to track progress across different steps.
Surprisingly, we discovered that the issue wasn’t just affecting individual team members—it was also a major pain point for HR and leadership teams. Without a unified view, they found it challenging to assess team alignment, identify bottlenecks, and drive meaningful improvements.
OBJECTIVE STATEMENT
How might we create a more cohesive & intuitive experience that connects the 5-Step Alignment Playbook, ensuring that teams can easily track their progress, understand the relationship between different steps, and provide leadership with a clear, actionable view of team alignment?
DETERMINING OUR DIRECTION
Deciding to create an external, high-level view of the Alignment Playbook
After validating and properly defining the problem, I questioned how I should begin to approach it. I came up with two possible design directions:
1
Mission
2
SWOT
3
OKR
4
Top 6
5
Retro
While the first option would improve navigation at the framework level—a location users are already familiar with—it didn’t address the core issue of creating an overall cohesive experience or providing leadership with a strategic, high-level view.
Evaluating the tradeoffs, I determined that the second option would meet user and business needs by streamlining the entire Alignment Playbook in one place while also empowering leadership to monitor team performance and make data-driven decisions.
IDEATION
Converting Team Member, HR, and Leadership needs into a dashboard
To begin brainstorming our key features, it was important to understand our different types of stakeholders:
Team Members
track personal & team progress
understand priorities & focus areas
identify blockers & improvement areas
HR & Leadership
monitor overall team performance
identify struggling teams & offer support
align teams with company-wide goals
Understanding the needs of our product feature, we set out to create a Workspace-level Dashboard with the following key features:
1
Clearly linking individual projects together as part of the Quarterly Playbook
2
Visually highlighting adoption & engagement insights
3
Displaying all teams data on a singular page
VERSION 1
Beginning to visualize the playbook
During our initial calls with both customers, we had established that we would work hand-in-hand with them throughout the development of our dashboard feature. When we presented our first mockup, we discovered some issues:
Issue #1: Self-reported ratings were not a useful metric for projects
After completing a project (ex: SWOT Analysis), teams would be able to rate the individual parts of their project, giving them a high-level score (ex: 8.2). Originally, we used this score as the data populating the dashboard. However, this wasn’t reliable nor was it providing our users with useful and consistent data. Some teams rated themselves optimistically, while others were overly critical.
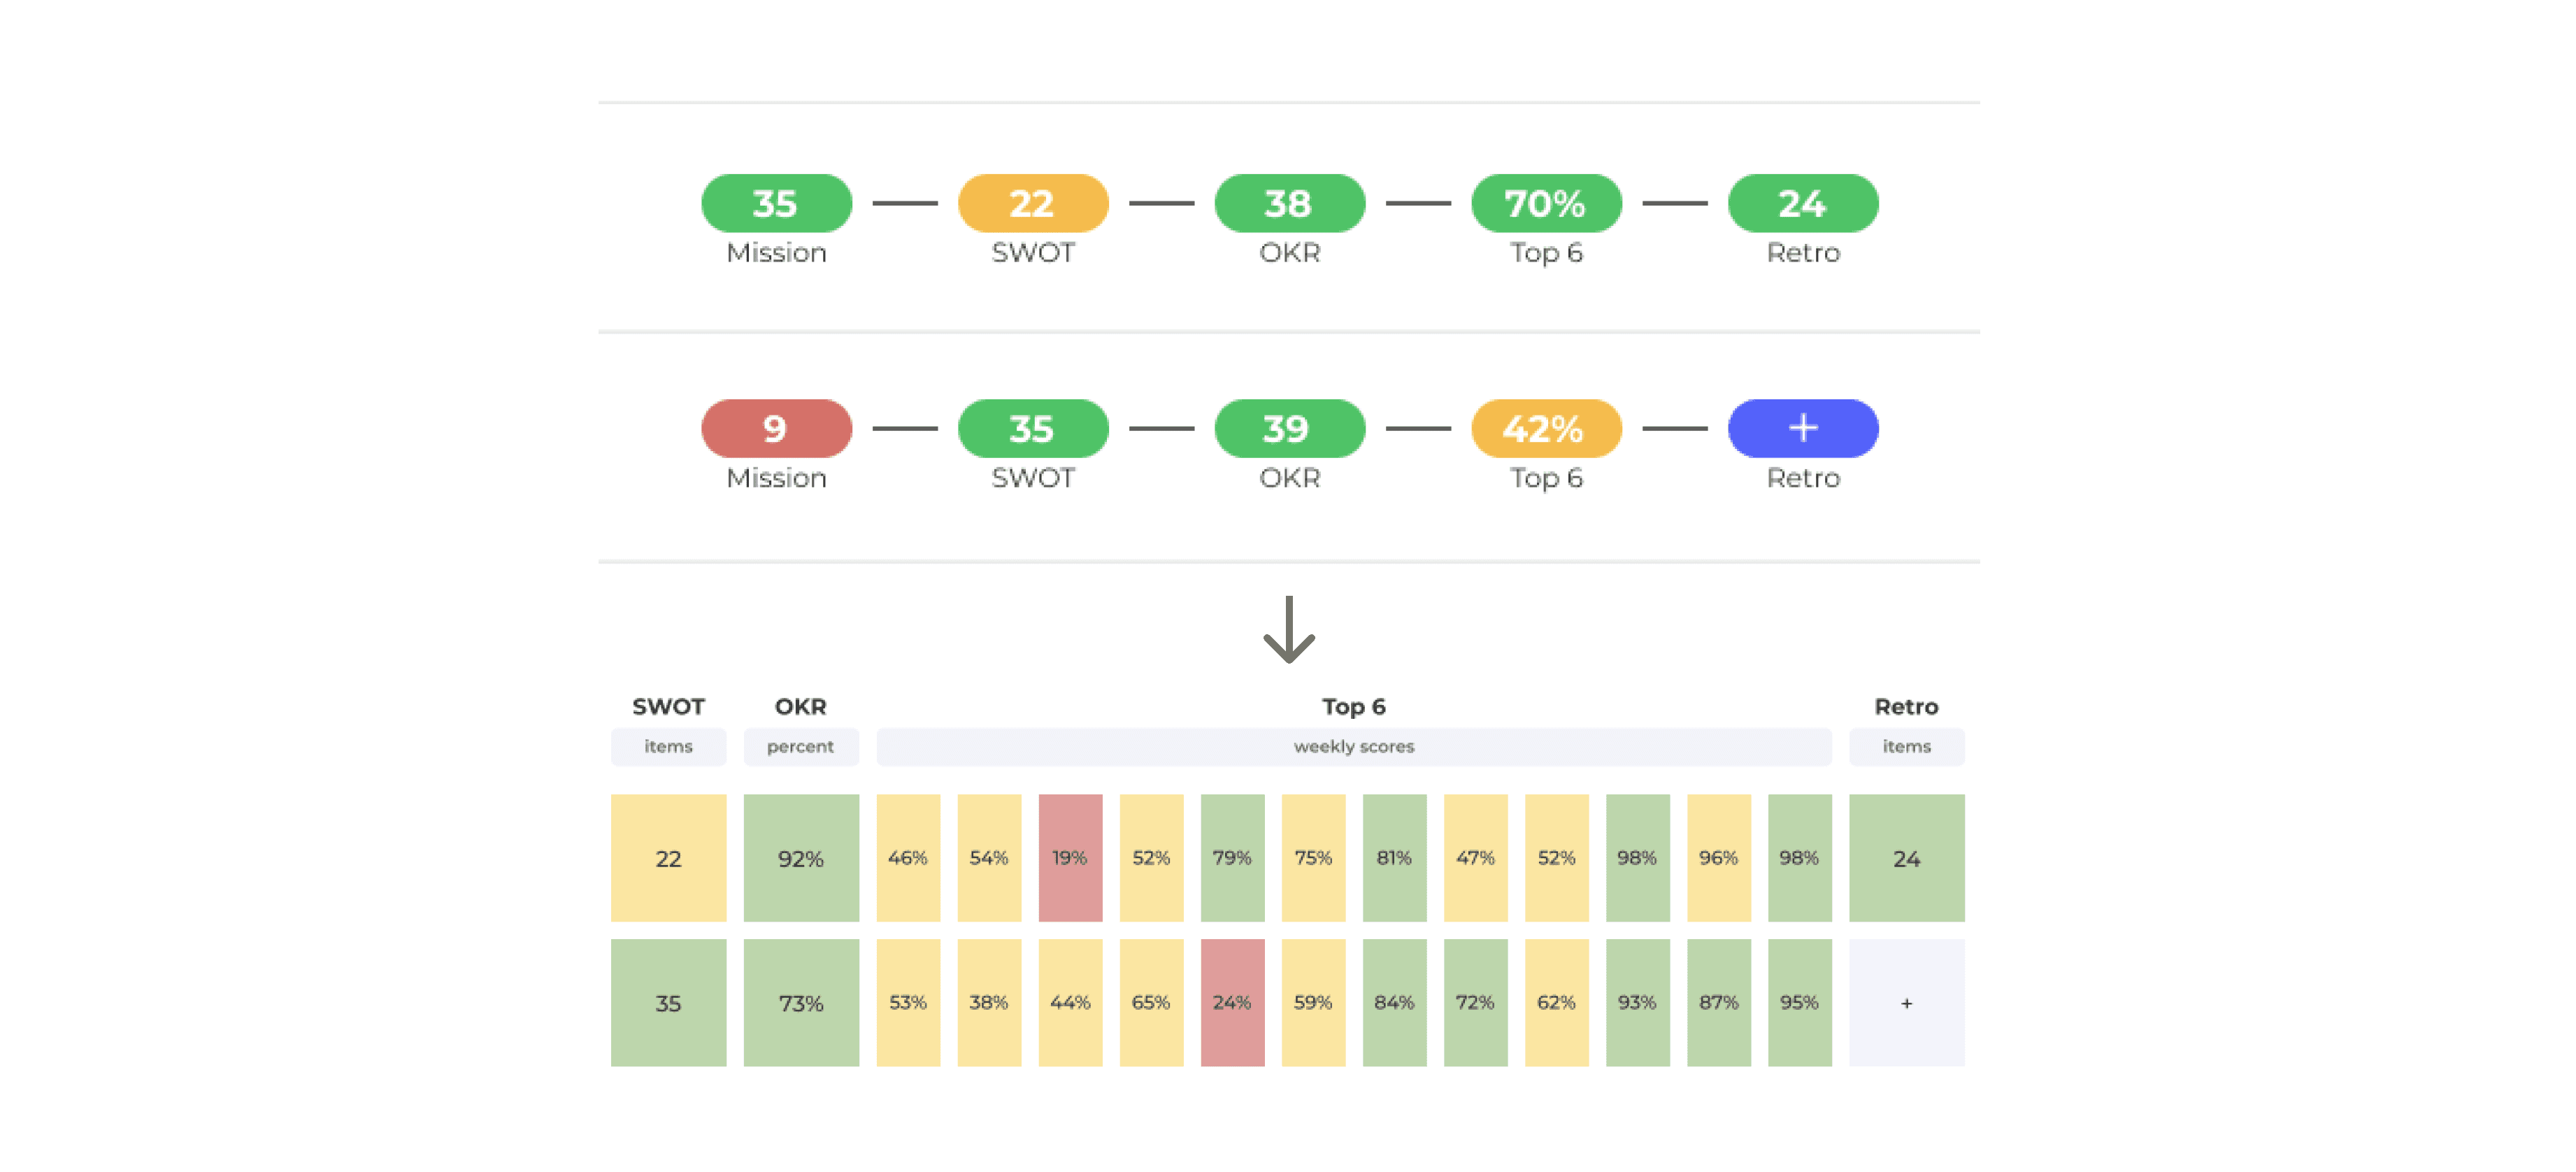
Iteration: Displaying success via project item count!
We switched from subjective ratings to project item counts, ensuring ratings were clear and data-backed measurements of engagement & adoption. A higher item count indicated a more comprehensive project--reflecting deeper alignment and team investment.
Issue #2: Dashboard organization didn’t allow for quick team comparison
We discovered that HR & Leadership struggled with comparing performance across groups. While the bubbles nicely connected individual team’s Playbook rhythm, they failed to provide a quick way to evaluate multiple teams at once to analyze workspace-wide performance.
Iteration: Heatmaps for better comparison!
Instead of isolated groups of bubbles, we introduced a heatmap format, making it easier to spot trends across teams at a glance and identify struggling teams without manual comparisons.
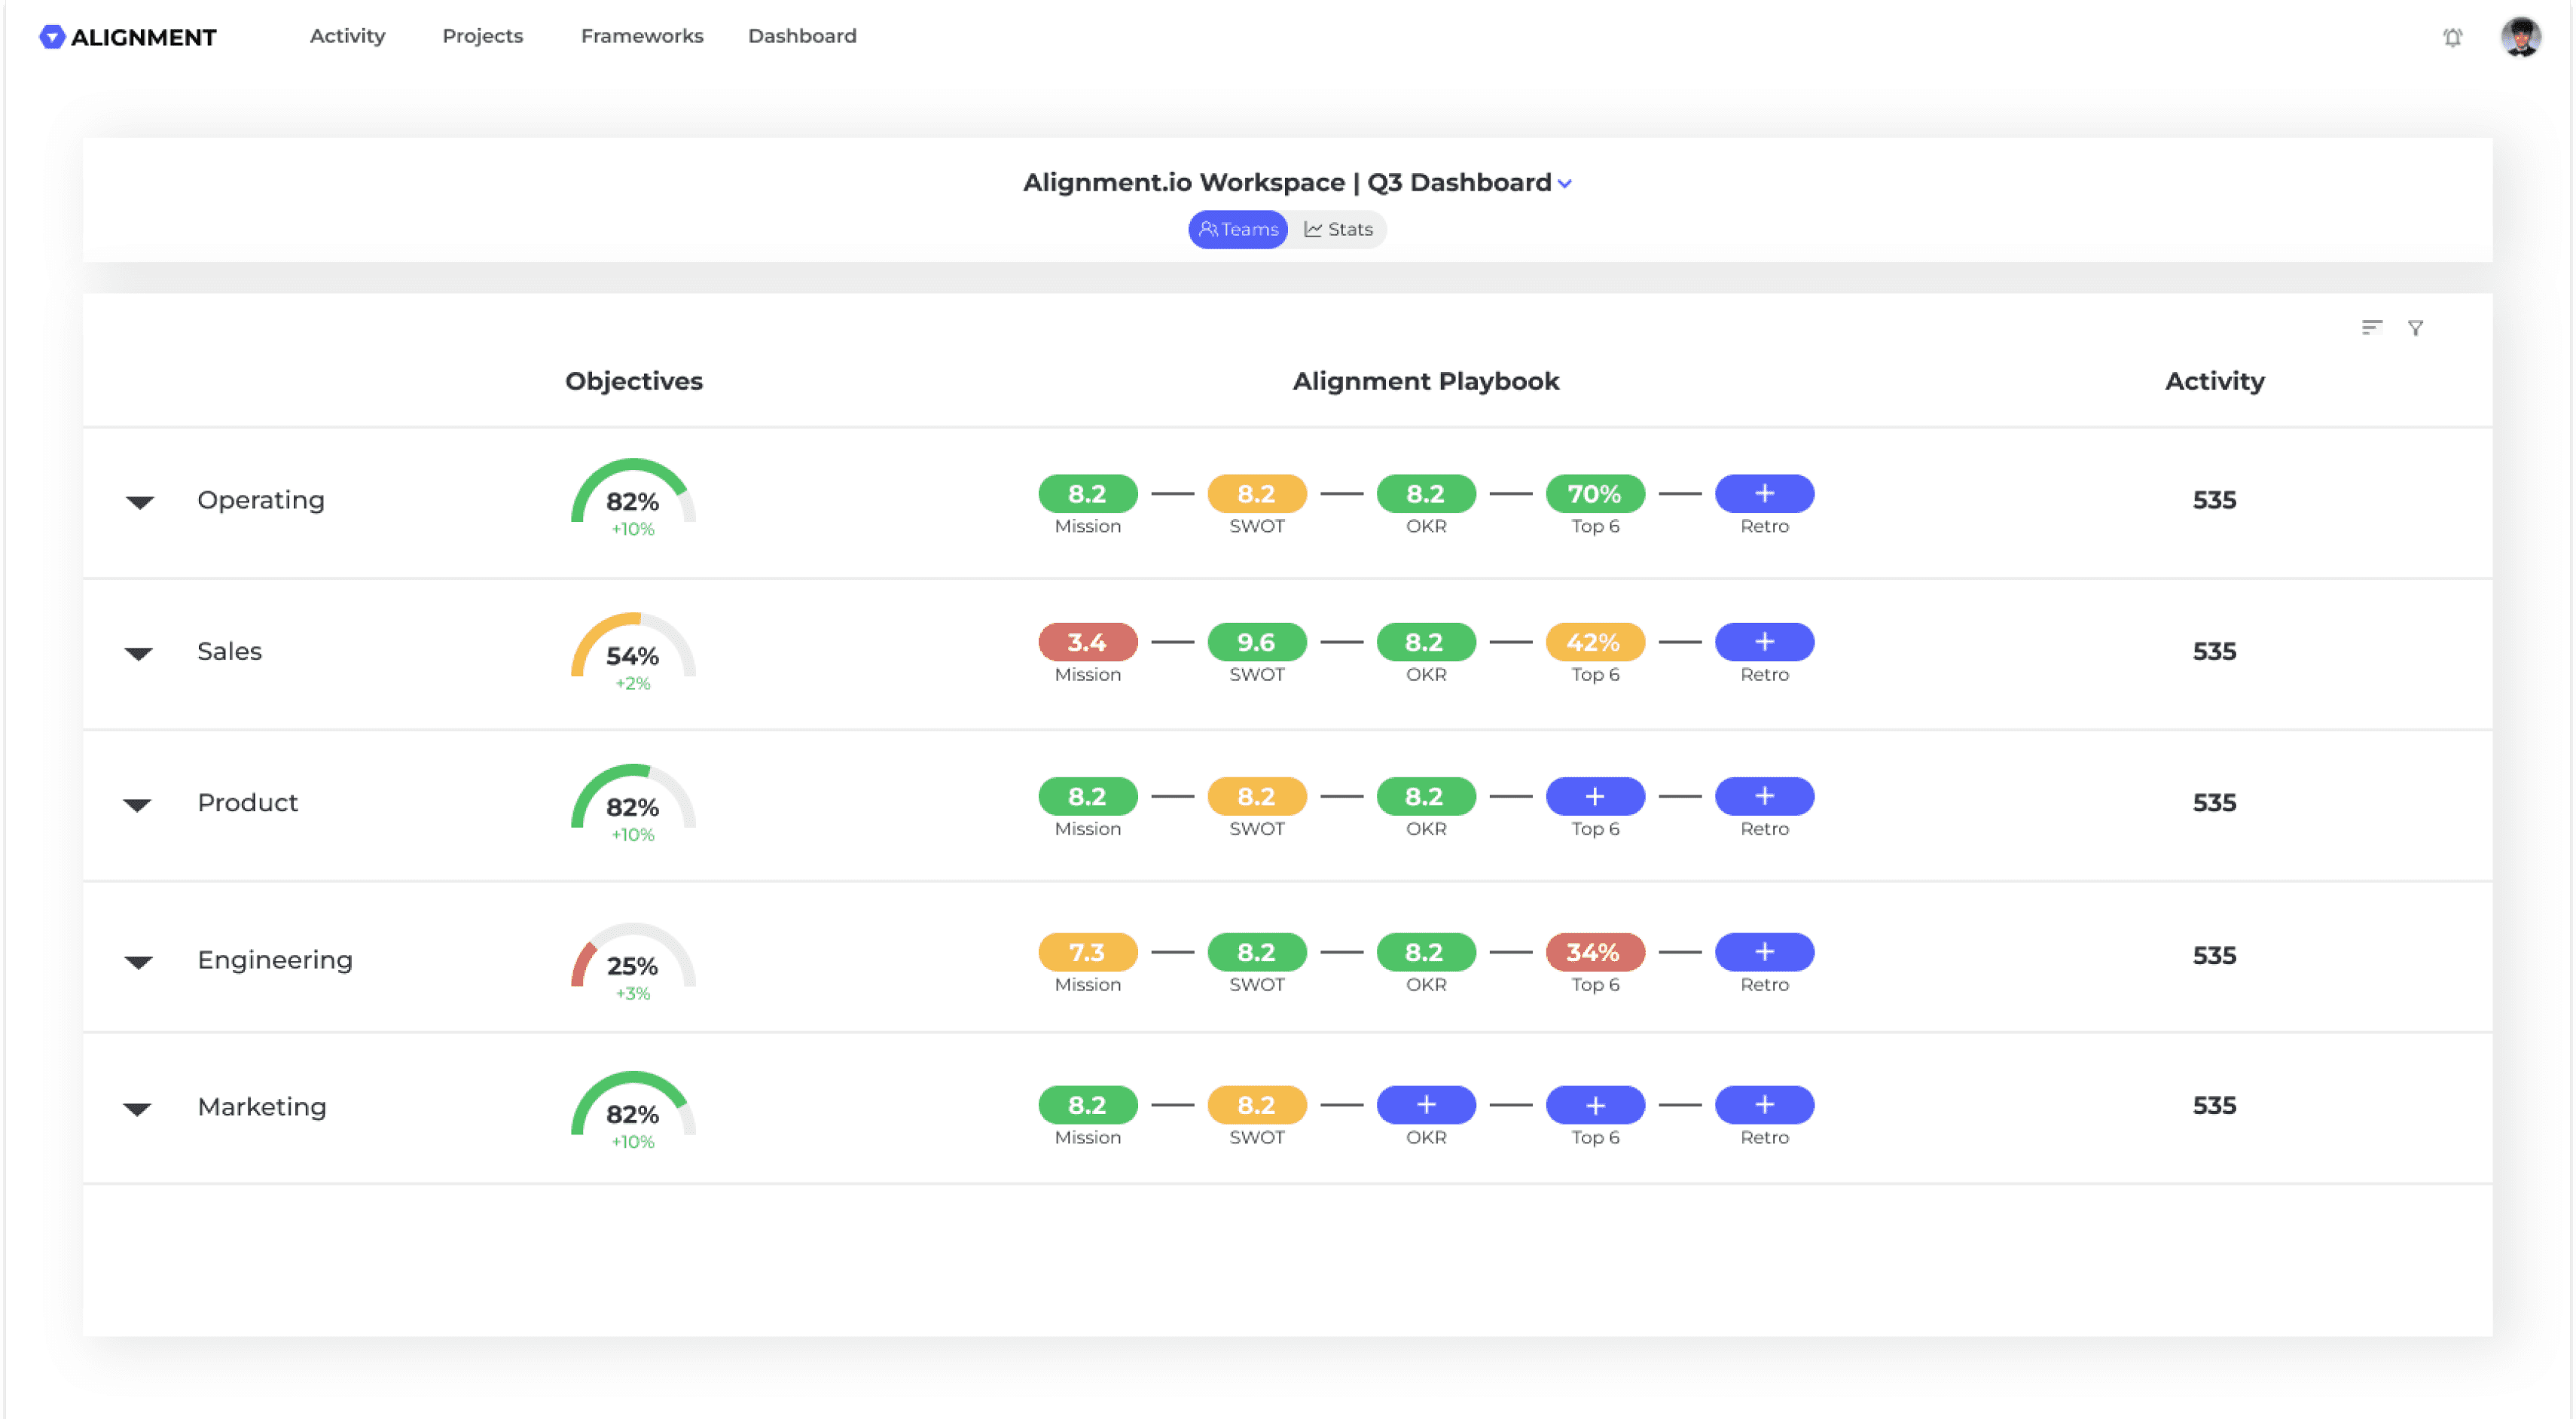
VERSION 2
Empowering easy workspace-wide analysis through a heatmap
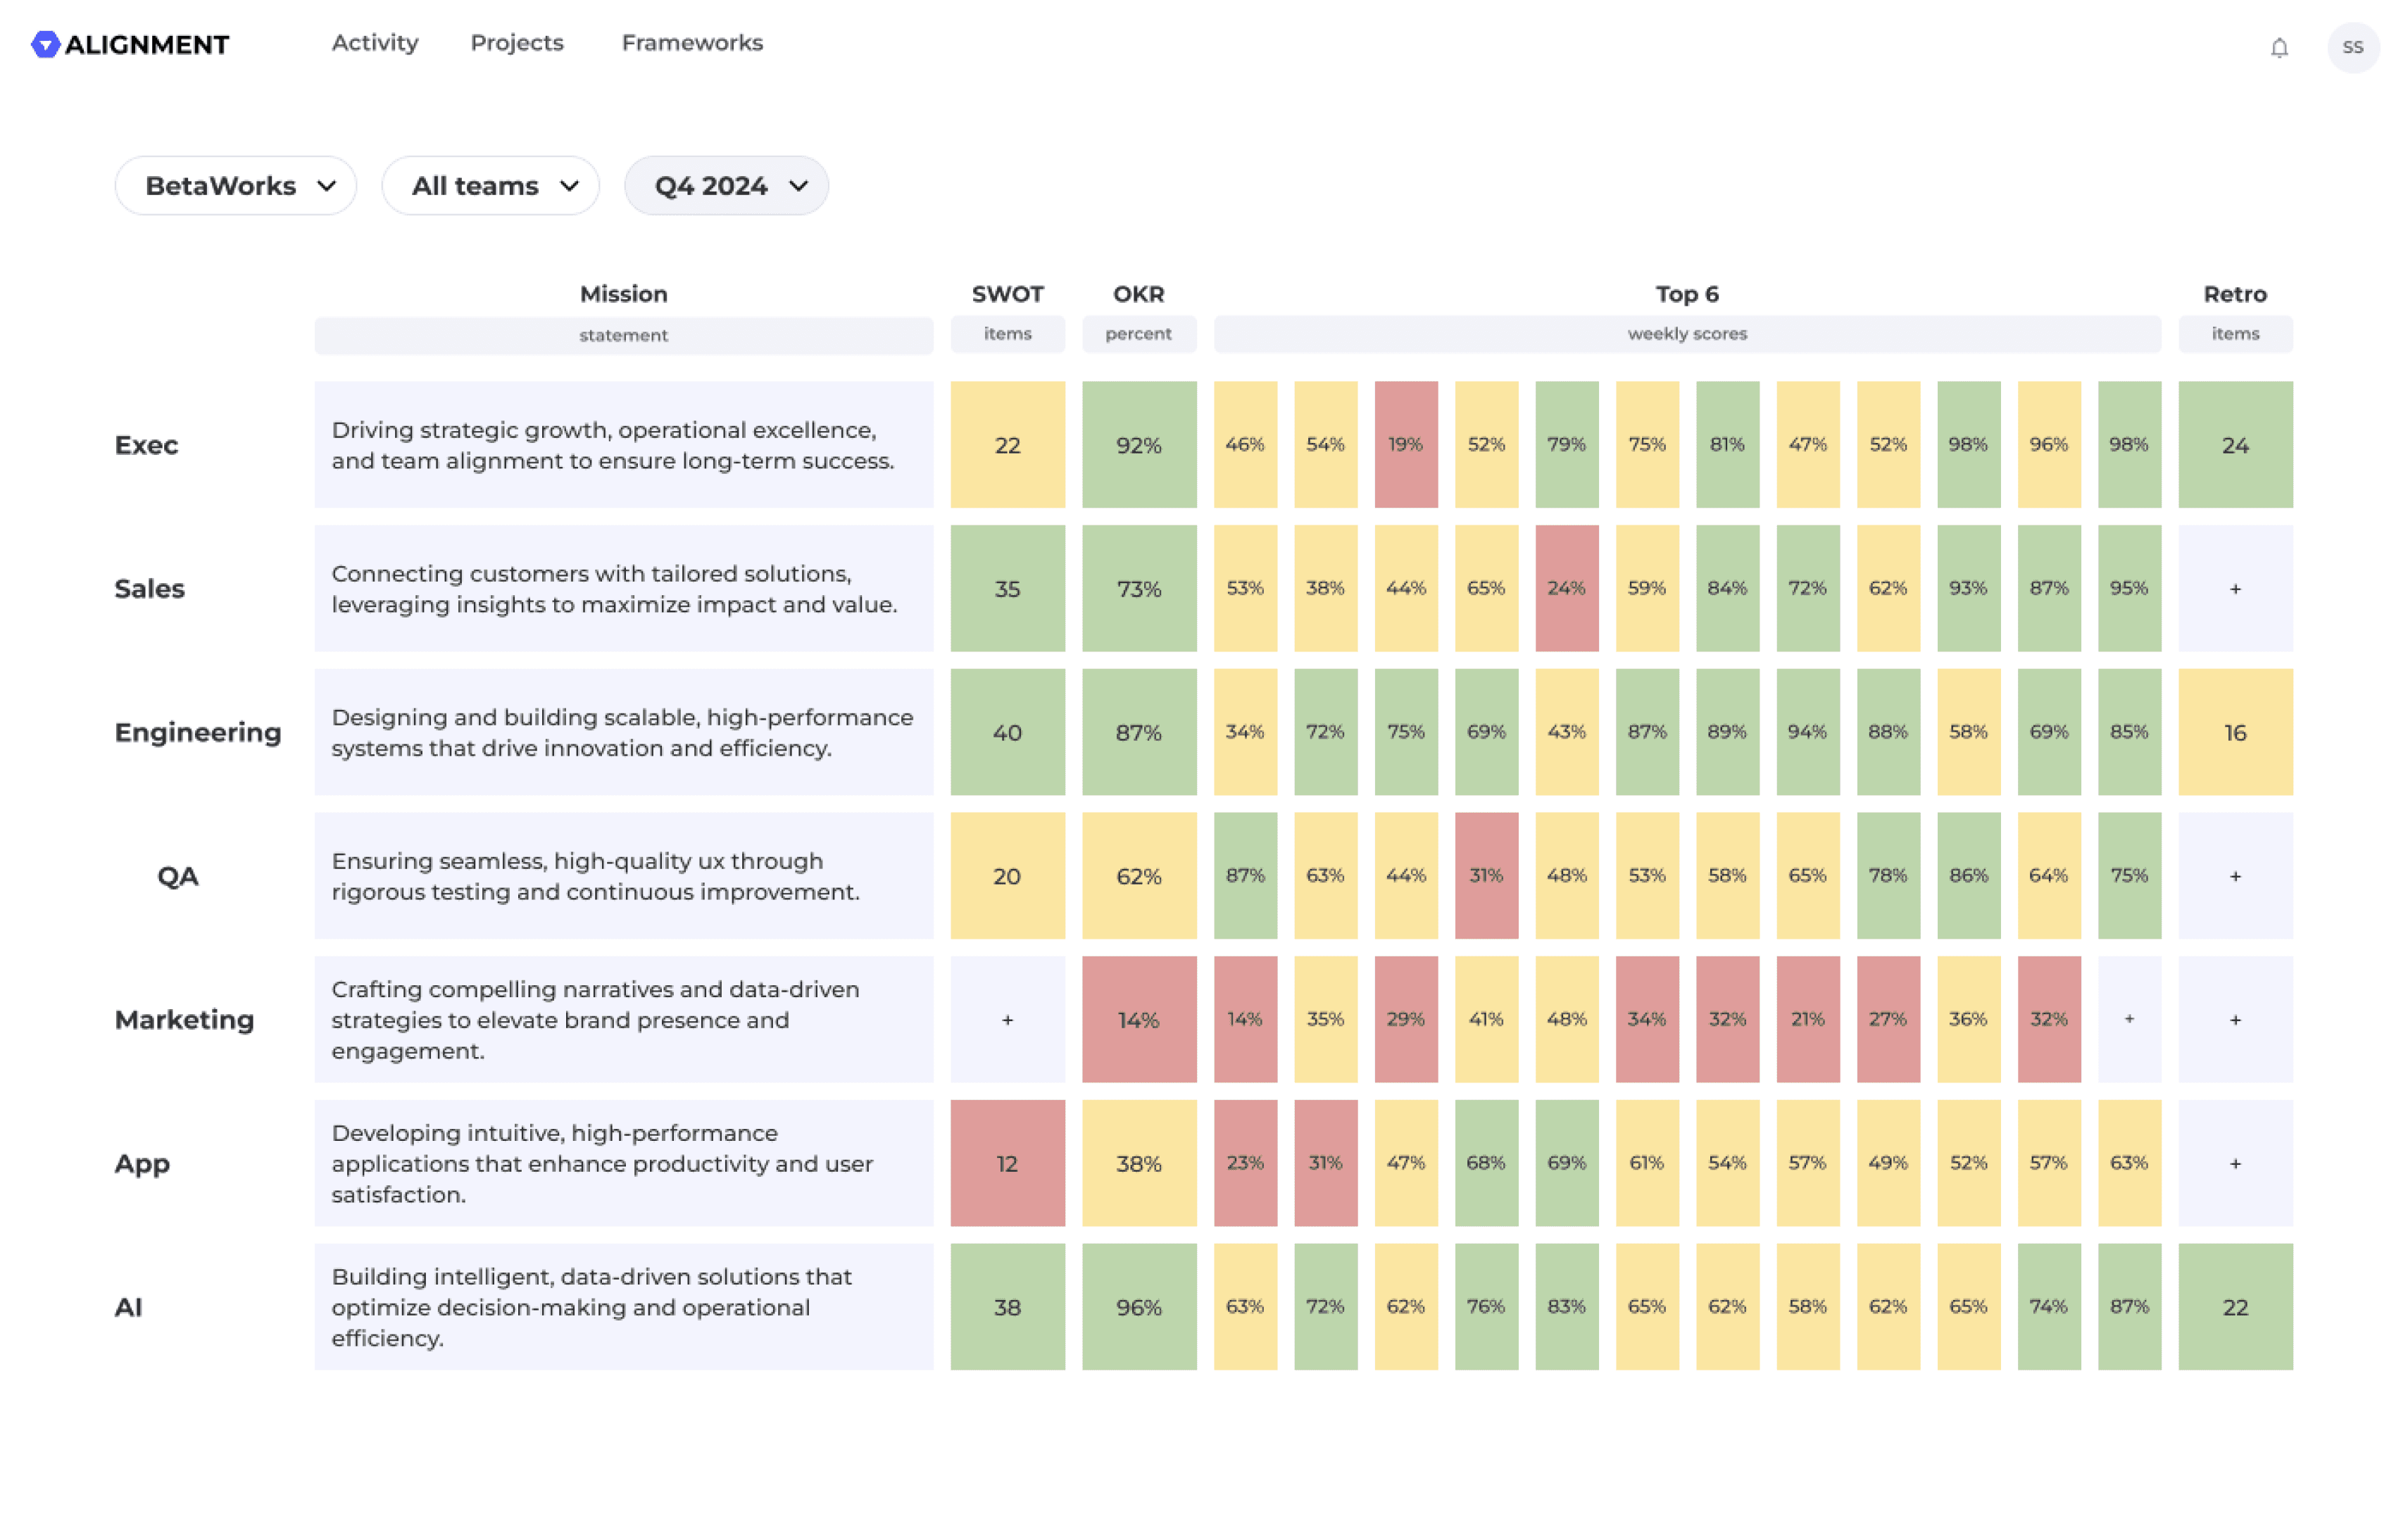
Apart from our main iterations, we also added
A simple navigation compass at the top to select the workspace, team, and quarter
The Mission Statement to drive home the team’s objective and contextualize their progress
Column labels to distinguish what the numbers in each different column indicate
After iterating, we hopped on another round of calls to gather more feedback.
Issue: The colors were discouraging
Users, especially team members, felt discouraged when seeing red on the dashboard, interpreting it as failure rather than an area for improvement. Leadership also noted that the red/yellow/green system created unnecessary anxiety instead of fostering alignment. Our color choices were impacting team morale and engagement.
Iteration: A softer, more constructive color system!
We replaced the red/yellow/green into a greyscale-to-purple gradient, maintaining the value of the heatmap while reducing negative psychological impact (and fitting in with our brand colors)
The deeper the purple, the greater the succes!
33%
66%
33%
66%
Both sets of customers loved the idea! After implementing the color changes, as well as streamlining some data visualization elements, we presented our final dashboard design.
FINAL DESIGN
An intuitive dashboard for seamless team insights
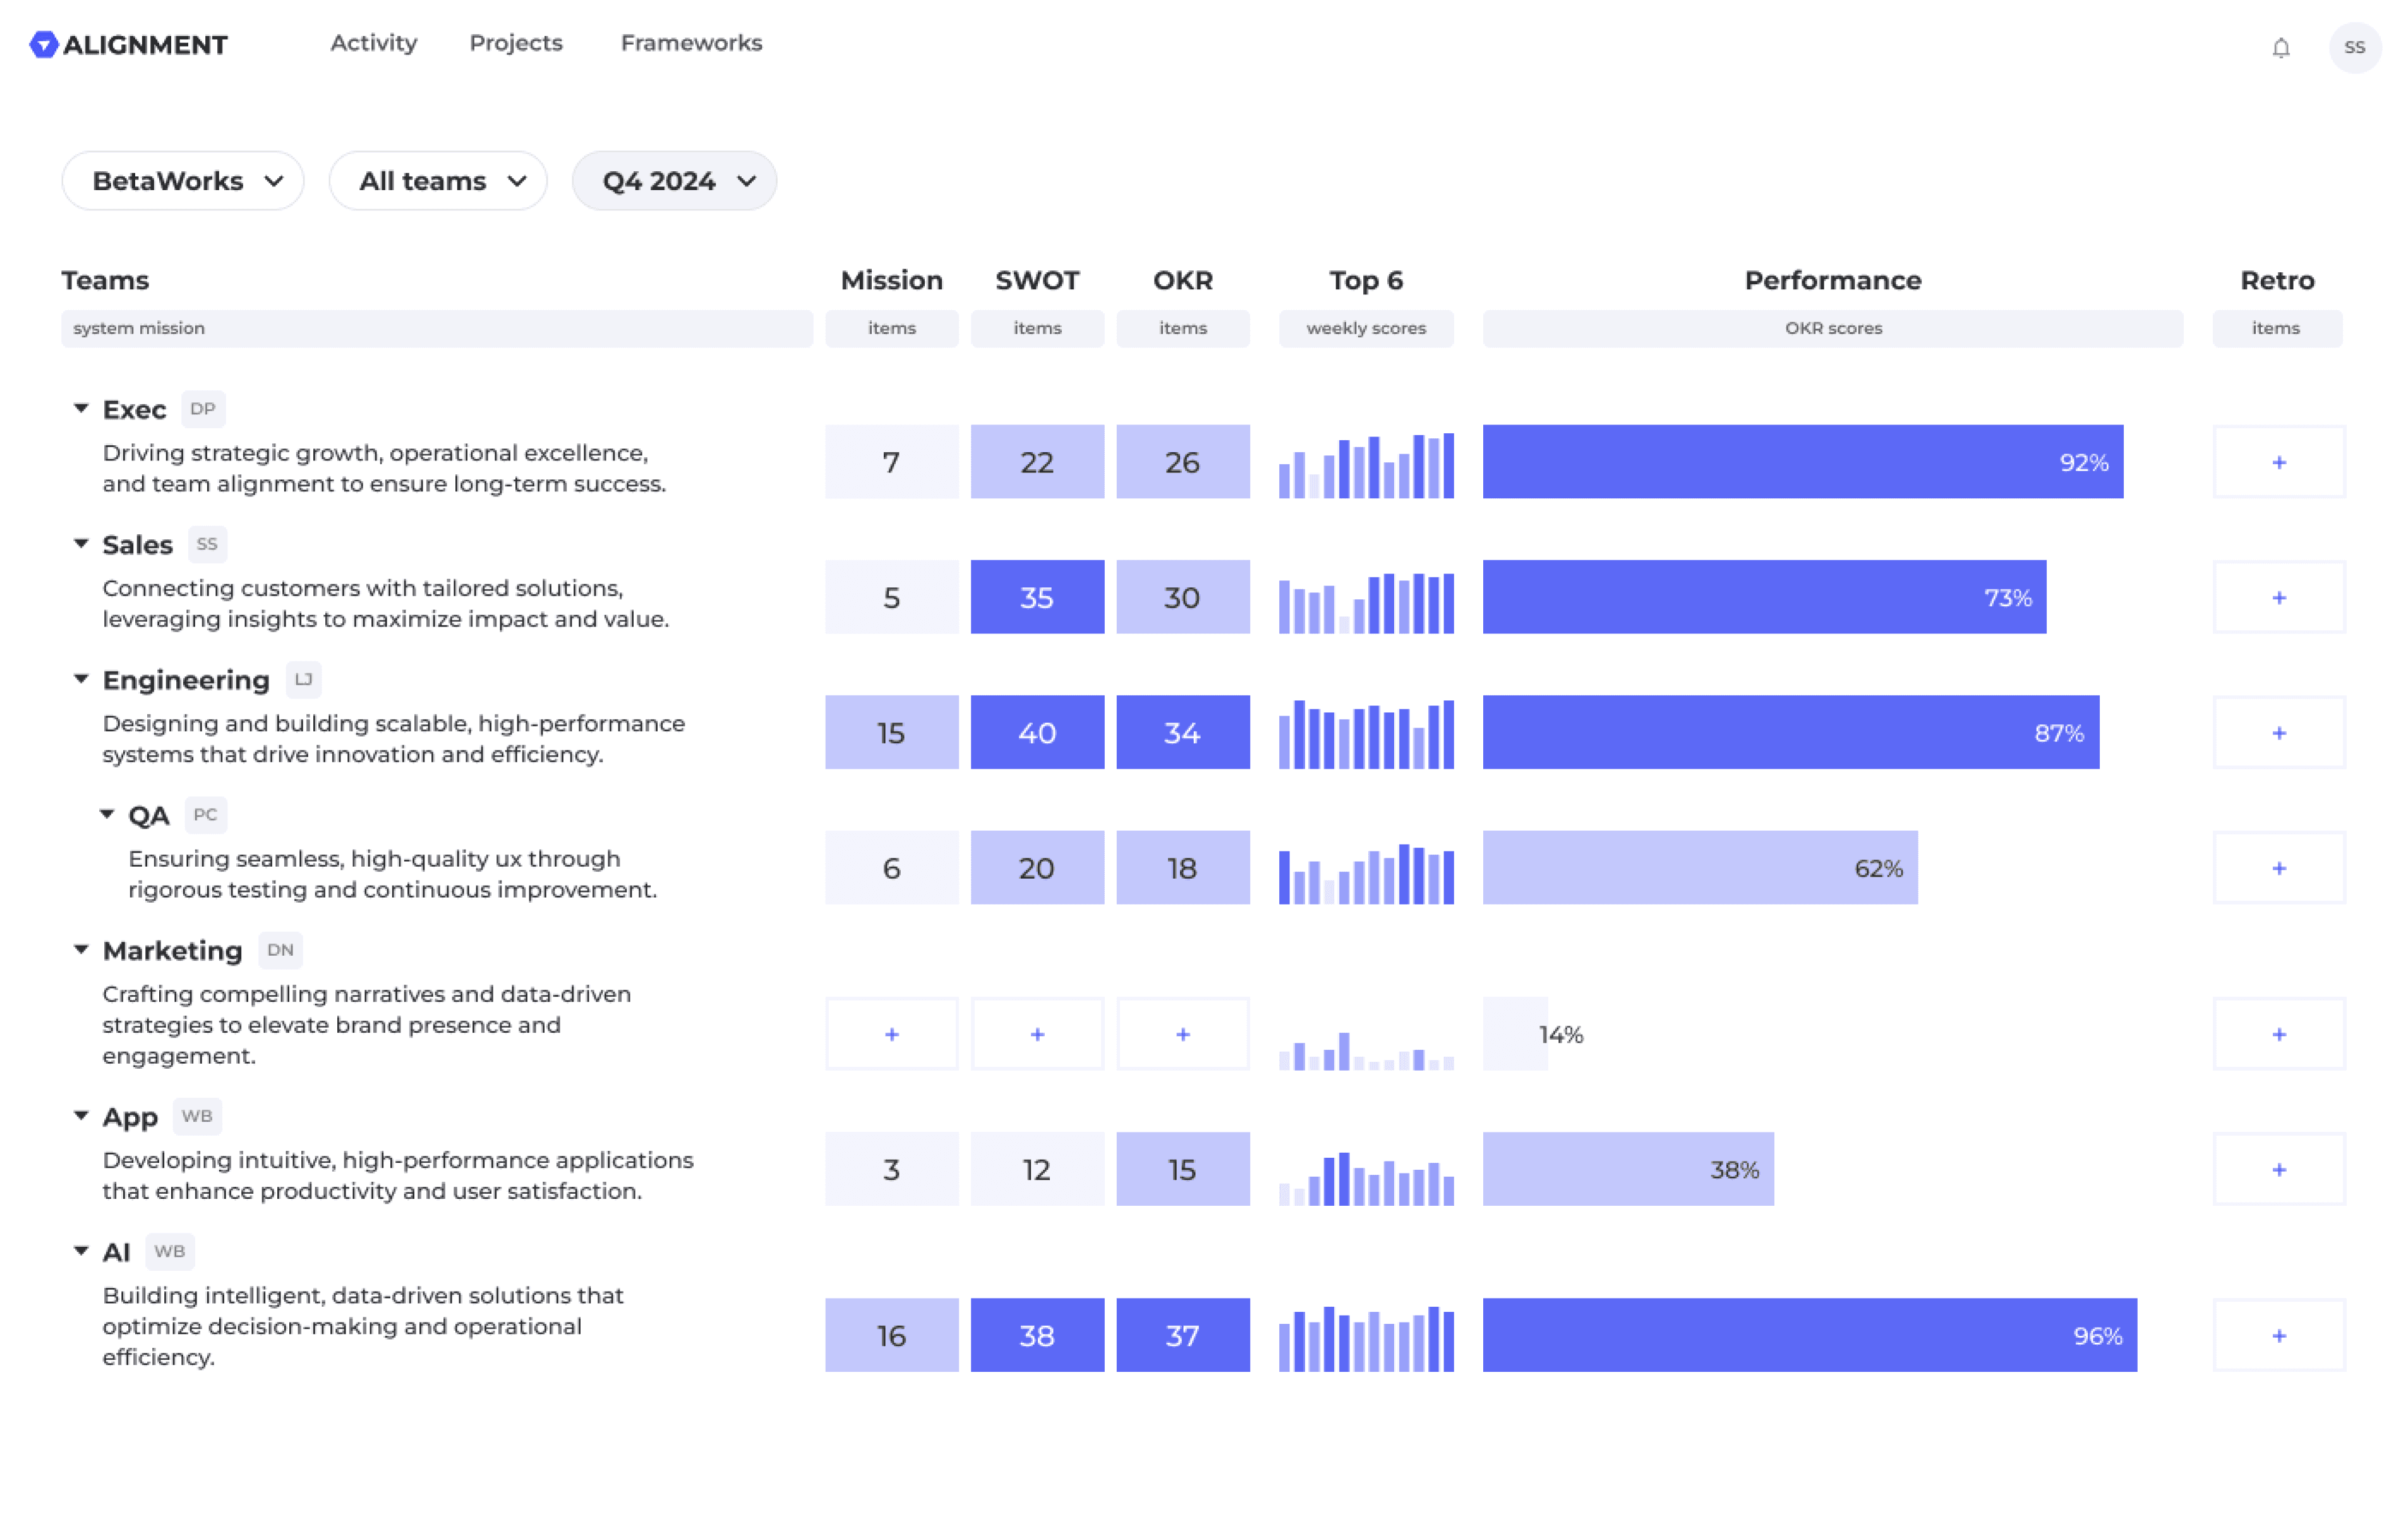
Apart from our main iterations, we also added
A simple navigation compass at the top to select the workspace, team, and quarter
The Mission Statement to drive home the team’s objective and contextualize their progress
Column labels to distinguish what the numbers in each different column indicate
After iterating, we hopped on another round of calls to gather more feedback.
Compass Navigation
Effortlessly navigate between different workspaces, teams, and quarters.
Additional Project Insights
Effortlessly navigate between different workspaces, teams, and quarters.
Creating New Project
Temp
LESSONS LEARNED
Designing with users, not just for them.
Working on the dashboard this summer was the most fulfilling part of my role. I led this project from initial research to final implementation, collaborating closely with both the Alignment team and two key customers.
This experience reinforced that the best solutions come from treating users as co-designers rather than just participants. Iterating directly with our customers throughout the process shaped a system that truly worked for them.
Moving forward, I’ll carry this mindset into future projects—prioritizing collaboration, continuous iteration, and designing with users to create impactful, user-driven solutions.
Thank you for visiting, let’s talk!
CONTACT
shreeshasatvik@gmail.com
/in/satvik-shreesha
resume
ETC.
made with love in Seattle, WA
open to work
© 2025 Portfolio by Satvik Shreesha